Can Statistics Be Sexy?
Well… the answer is probably not, but they can help us understand if the data is relevant and what results can most likely be replicated in your paddocks.
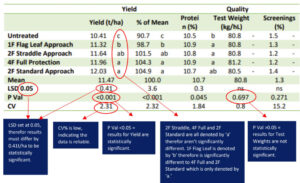
P-value (P -val) tells us the probability of all our data being statistically similar. In agriculture, <0.05 is generally acceptable. If p-value is >0.05 it means that there is not anything statistically significant happening between the results.
Coefficient of variation percentage (CV%) is a measure of how variable the data set is around the mean. It is the standard deviation divided by the mean. A lower CV% means the data set is tight around the mean, conversely a large CV% means that data set has a large span either side of the mean. CV% thresholds will very dependent on the trial, generally CV <10% is desirable.
Least significant difference (LSD) shows where there is a statistical difference, usually this is set at 0.05 (if higher than this, the author usually states why). If two data value s are greater than the LSD value, then there is only a 5% chance that they can statistically be the same. Values must therefor be greater than the LSD apart to be significantly different. Often a letter will be used next to the treatment result to showcase that there is statistical significance between results that do not have the same
letter.